CHAPTER
1 : NATIONAL CIRCUMSTANCES,
1995
BACKGROUND
General
Republic of Mauritius
 The
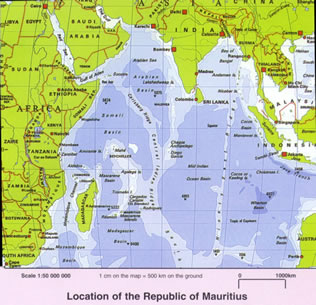
Republic of Mauritius consists of a main island, Mauritius, and a group
of small islands scattered in the South West Indian Ocean namely: Rodrigues, the
Cargados carajos St. Brandon, Agalega, Tromelin and the Chagos Archipelago Diego
Garcia. The total land area of the Republic of Mauritius is 2040 km2.
It is surrounded by coral reefs and is situated at about 2000 km off the East
coast of Africa.
Exclusive Economic Zone
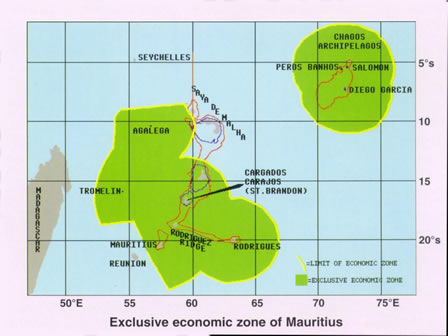
The Marine Exclusive economic Zone of the
Republic of Mauritius is about 2 million km2
. It extends approximately from latitude 10°S to 20°S and from
longitude 55° to 75°E.
GEOGRAPHY
AND HISTORY OF MAURITIUS AND THE OUTER ISLANDS
Geography
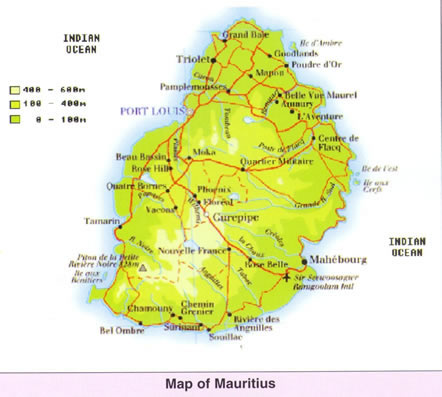
Mauritius
 Mauritius,
an Indian Ocean island, is situated between latitudes 19°50’ south and 20°30’
south, and between longitudes 57°18’ east and 57°46’ east. It has a surface
area of 1865 km2. The Island consists of an irregular
Central Plateau surrounded by mountain ranges and plains. The Central Plateau
has a mean elevation of about 300-400 m and rises to a maximum height of about
600 m in the South of the Island, the highest peak being 828 m. The Island is
the result of four major volcanic activity periods between 7.8 million and 25
000 years ago.
Rodrigues
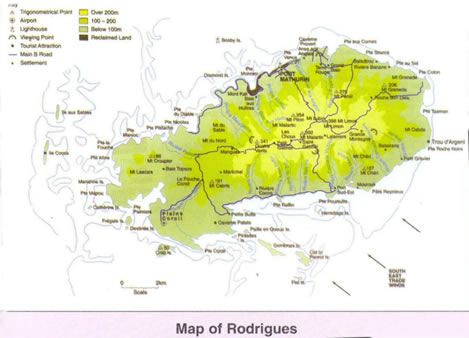 Rodrigues
lies between latitudes 19°40’ and 19°46’ south and longitudes 63°20’
and 63°30’ east at about 720 km to the North East of Mauritius. It is the
youngest of the Mascarene islands, is hilly and rocky with the highest peak rising
to about 398m. Like Mauritius, it is made up of basaltic lavas but is also covered
by volcanic dust in some areas. There are small areas in the South and the East
where sand blown by wind has accumulated to form limestone rocks. Caves are found
in these areas.
St. Brandon
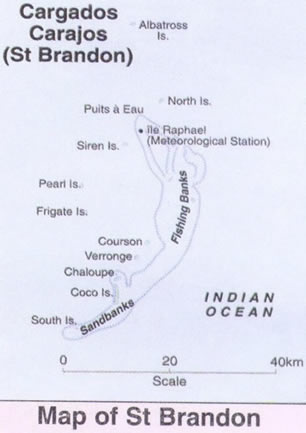 St
Brandon forms part of the Cargados Carajos shoals that are made up of numerous
sand banks and are situated about 350 km off the North North-East of Mauritius.
The main islet, Raphael island, lies at latitude 16°27’ south and longitude
59°36’ east. These sand banks undergo marked changes in their shorelines under
the effects of extreme weather.
Agalega
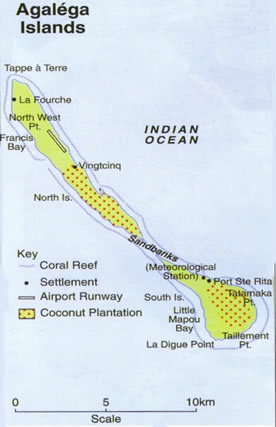 Agalega
is made up of two small islands: North and South Islands, found approximately
1000 km north of Mauritius. The two islands are separated by a strip of shallow
water about 1 km wide. At low tide, it is possible to walk from one island to
the other. North Island lies between latitudes 10°20’ and 10°25’ south
and longitudes 56°34’ and 56°38’ east. It has an elongated shape, extending
along a northwest-southeast axis and is approximately 1 km wide. South Island
also extends in a northwest-southeast axis, is pear-shaped and lies between latitudes
10°26’ and 10°28’ south and longitudes 56°39’ and 56°42’ east.
It is about 2 km at its widest part.
History
Mauritius was first visited by the Polynesians followed
by the Arabs and the Portuguese. It was ultimately colonized by the Dutch
on 20 September 1598 when Van Warwick took possession of the island and
named it Mauritius. The first settlers arrived on the island, on 30 July
1638. The first birth was recorded on 14 November 1639. Sugar cane and
the famous Javanese deer were introduced into the island during this period
that also saw the extinction of the famous indigenous bird, the dodo. This
period of colonization ended on the 16 of July 1658. 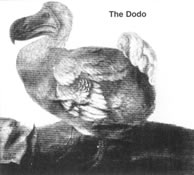
The first Frenchman, Guillaume Dufresne D’Arsel
on board ‘Le Chasseur’ landed at Baie du Tombeau on 27 August 1715.
The French officially took possession of the island on 20 September 1715.
Under their rule, large expanses of land were allocated to French citizens
willing to set up sugar cane plantations and this was the first step leading
to the establishment of the agricultural base of the country. Slave labour
was imported from Africa and Madagascar to work in the sugar cane plantations.
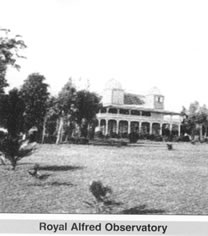 In
their quest to control the route to the east the British conquered the island
from the French in 1810. Inclusion in the British empire did not affect the country’s
agriculture, culture and laws, as agreed under the Treaty of Paris signed in 1814,
and English became the official language in 1827. After the abolition of slavery
in 1835, indentured labourers were brought in from India to work in the cane plantations.
A period of continuous infrastructural development followed alongside the expansion
of the sugar industry. The end of the 19th century saw a
continuous struggle for social and economic emancipation that resulted in the
establishment of health and educational facilities. These socio-economic improvements
prepared the population and paved the way towards Independence. Mauritius and
its outer islands became Independent on 12 March 1968 and was proclaimed a Republic
in March 1992.
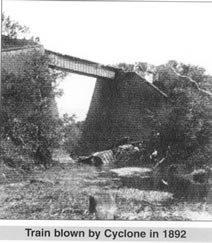 The
Mauritius Independence Order, which established a self-governing state, came into
force on 12 March 1968, and was subsequently amended. Constitutional amendments
providing for the adoption of republican status were approved by the Legislative
Assembly henceforth known as the National Assembly on 10 December 1991, and came
into effect on 12 March 1992. The main provisions of the revised Constitution
are:
-
The Head of State is the President of the Republic,
who is elected by a simple majority of the National Assembly for a five-year
term of office. The President appoints the Prime Minister in whom executive
power is vested and, on the latter’s recommendation, other ministers.
-
The council of ministers, which is headed by the Prime
Minister, is appointed by the President and is responsible to the National
Assembly.
-
The National Assembly, which has a term of five years,
comprises the Speaker, 62 members elected by universal adult suffrage,
a maximum of eight additional members and the Attorney-General if not
an elected member. The island of Mauritius is divided into 20 three-member
constituencies for legilative elections. Rodrigues returns two members
to the National Assembly. The official language of the National Assembly
is English, but any member may address the Speaker in French.
-
The eight additional members are best losers nominated
by the electoral commissioner to maintain the ethnic balance in the National
Assembly.
CLIMATE
Mauritius and Rodrigues
Mauritius and Rodrigues lie near the edge of the
southern tropical belt and are free from the influence of large land masses
or continents. They enjoy a mild maritime climate with summer extending
from November to April and winter from June to September. May and October
are transition months during which the weather is generally variable.
Both islands are swept by trade winds throughout
the year, except for some short periods, in summer months when tropical
depressions approach the island. The trades are stronger and more persistent
in winter when strong anticyclones pass to the south and close to the Mascarenes
the islands of Reunion, Mauritius and Rodrigues. In summer, the trades
are weaker as the subtropical anticyclones become less intensive and migrate
polewards.
Weather systems that
affect Mauritius and Rodrigues
Winter
Weather over the Mascarenes is dominated by anticyclones
migrating equatorwards, and then moving eastwards along the southern high
latitudes, during most of the winter months. Anticyclones are areas of
high pressure around which winds blow in a counterclockwise direction southern
hemisphere. These anticyclones bring cold air over the region and at times
can penetrate up to latitude 10° south.
Cold fronts, a belt of active weather with cold air
replacing warm tropical air, cross the latitudes of the Mascarenes at a
frequency of about one per week, giving rise to rainy and chilly weather
with sudden significant drops in air temperature.
In between the anticyclones, cool and fine weather
prevails when Mauritius remains in a region of light wind conditions. Trades,
blowing in winter months, are very strong and gusts reaching more than
70 km h-1 are often recorded.
Summer
Weather remains under the influence of systems coming
mainly from the east. The sub-tropical anticyclones migrate further towards
the pole and weaken at the same time giving rise to lighter trades over
the region.
Low pressure areas and waves in the easterlies from
the equatorial region, are frequently observed in the vicinity of the region
and adverse weather conditions occur when these systems affect Mauritius
or Rodrigues.
The Inter Tropical Convergence Zone, ITZC, a belt
of thundery weather where air masses from both hemispheres meet, usually
lies between latitudes 08° and 15° south. It influences weather
at times over the region, giving rise to torrential rains.
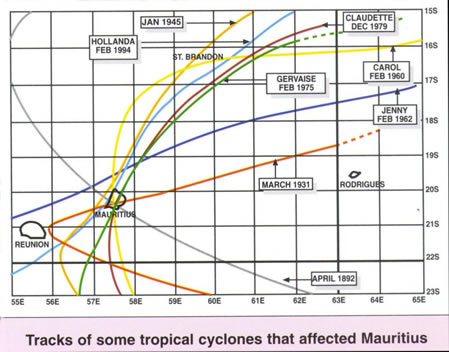
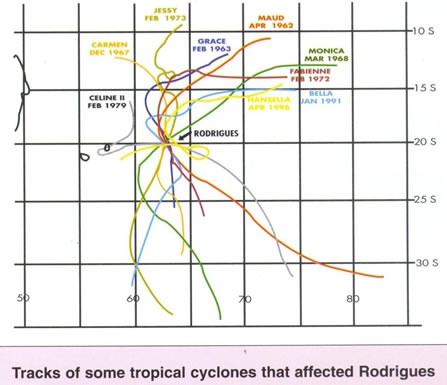
Tropical Cyclones
The cyclonic season officially starts on 1 November
and ends on 15 May. On average, ten named tropical depressions are tracked
in the South-West Indian Ocean and of these, three reach tropical cyclone
intensity. On average one tropical cyclone passes within 100 km of Mauritius
each year.
Formation / Classification
of Tropical Cyclones
Tropical Cyclones usually form on the Inter-tropical
Convergence Zone ITCZ. Small waves, on the ITCZ develop into vortices
that sometimes intensify into tropical storms. They are named on reaching
moderate intensity.
Classification of tropical storms
| Class |
Maximum wind speed kmh-1 |
| Tropical Storm |
below
61 |
| Moderate Tropical Storm |
62-88 |
| Severe Tropical Storm |
89-117 |
| Tropical Cyclone |
118-165 |
| Intense Tropical Cyclone |
166-212 |
| Very Intense Tropical Cyclone |
above
212 |
Tracking of Tropical
Cyclones
Tropical cyclones are tracked through satellite imageries:
the NOAA polar-orbiting satellite and the METEOSAT geo-stationary satellite.
Another operational tool is the use of the traditional weather chart analysis.
The accuracy of locating the center position from chart analysis is poor,
especially in areas where data is sparse, such as the South West Indian
Ocean. Information from world centres also help in the positioning of tropical
cyclone centres. Furthermore, when tropical cyclones arrive within 400
km of Mauritius, tracking becomes more accurate through the use of a 10
cm weather radar.
Cyclone Warning System
Whenever a tropical cyclone threatens Mauritius or
Rodrigues, cyclone warnings are issued to enable inhabitants to take necessary
precautions. The cyclone warning system comprises four classes of warnings
each being determined by the degree of risk of cyclonic conditions. These
warnings are issued taking into consideration the lead time necessary for
the population to take precautionary measures.
Classes of warnings
| Class I: |
36-48 hours before Mauritius or Rodrigues
is likely to be affected |
| Class II: |
as far as practicable, 12 hours of daylight
lead time before the occurrence of gusts of 120 Km hr-1 |
| Class III: |
as far as practicable, a lead time
of 6 daylight hours before the advent of gusts of 120 Km hr-1 |
| Class IV: |
gusts of the order of 120 Km hr-1
have occurred and are expected to continue |
These cyclone warnings are disseminated through the
radio, television, telephone and the press. A visual form of warning is
also used, the number of red flags hoisted on public buildings indicates
the class of warning in force.
Mauritius and Rodrigues are exposed to the risks
of tropical cyclones. The latter's future behaviour under expected climate
change scenarios, especially their intensities and destructive forces are
being projected to be more severe. The impacts of tropical cyclones on
the economies of small island states are well-known. Increased severity
may cause greater setbacks to these economies which would take more time
to recover.
Climate parameters
Rainfall
 Mauritius
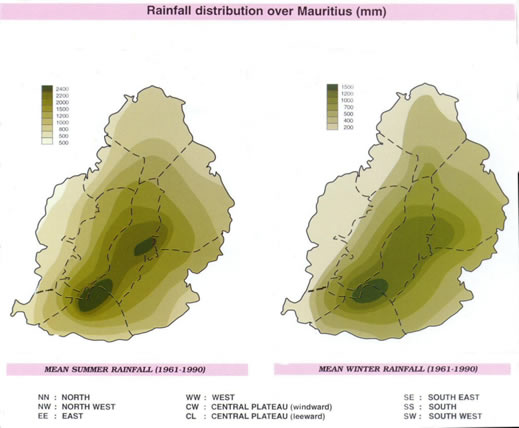
receives an annual average of 2100 mm of rain with about 70% of it occurring
in summer. Strong insolation, light winds and moist and unstable airmass
are the prerequisites for cloud development. Violent thunderstorms accompanied
by heavy downpours commonly occur.
Tropical systems such as depressions, cyclones, and
the ITCZ bring abundant rainfall spread over a number of days. This rainfall
fills the reservoirs and replenishes the aquifers. The heavy thundershowers
have a lesser contribution due to instantaneous runoff.
Winter rainfall, caused by the orographic ascent
of the south-east trades, is mostly confined to the East, South and central
plateau with the leeward side of the island remaining dry. Cold fronts
passing over Mauritius from time to time bring appreciable amounts of rainfall.
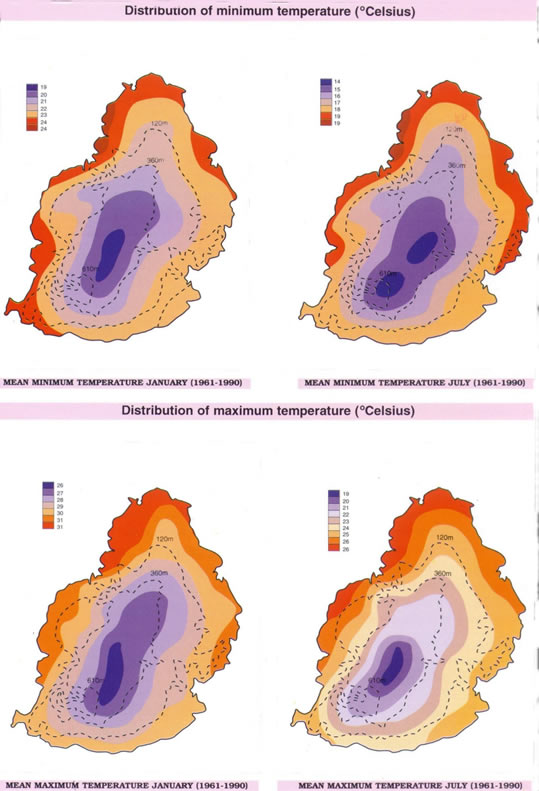
Temperature
Annual temperature distribution over Mauritius and
Rodrigues are characterized by a mean maximum of 31°C along the northern
and western coastal areas in December and January and a mean minimum temperature
of about 14°C over the plateau in July and August. Absolute maximum
and minimum temperatures recorded have been 37.5°C and 6.5°C respectively.
Sunshine
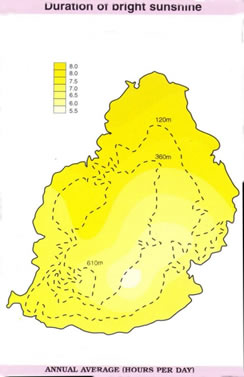 Short
wave solar radiation varies from about 14 MJ m-2
day-1 in the uplands to about 19 MJ m-2
day-1 in the northern plains, i.e. from about
5000 to 7000 MJ m-2 year-1.
The lowest amount of solar radiation is received during the month of June for
most sites while the highest amount is received in December-January.
Agalega and St Brandon
Weather over these islands is dominated by the influx
of warm and moist tropical airmasses for most of the year. The ITCZ is
active and provokes heavy and often thundery showers. Occasionally, St
Brandon suffers from the direct effects of tropical cyclones, so much that
the configuration of the island rarely remains the same after their passage.
Agalega is just off the path of these cyclones and is just brushed by their
relatively weaker northern parts. On average one severe tropical cyclone
visits St Brandon each season.
Cold air originating from the subtropical anticyclones
to the South of the Mascarenes, invades these islands for about 2 months
during winter when strong winds are observed in the low levels of the atmosphere.
POPULATION
and WELFARE
Population
The inhabitants of Mauritius are descendants of immigrants
from the major continents that have peopled the world, namely Asia, Africa
and Europe, and all the major religions such as Buddhism, Christianism,
Hinduism and Islam are practised. This mosaic of races and cultures
co-exist peacefully, making Mauritius a perfect example of social harmony.
Mauritius is also multilingual with English and French as official languages.
The oriental languages originating from India and China are also spoken
and/or written by part of the population. The population of Rodrigues originates
mainly from Africa.
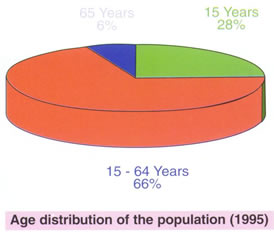 At
the end of 1995 the population of the Republic of Mauritius was estimated at 1
129 428 of whom 564 996 were males and 564 432 females. With 560 persons per km2,
the country ranks high in population density. Urban population represents about
43.5% of the total population.
The population of Rodrigues and Agalega are 35 000
and 300 respectively while St Brandon is not permanently inhabited but
only visited by fishermen.
Life expectancy 70 years is among the highest in
Africa with males reaching 66 years and females 74 years. The population
growth rate for the Republic has declined over time and stabilized at around
1% since the 1990s. Infant mortality rate continues to fall due to improvements
in the health care system. It was around 22 per thousand in 1995.
Welfare
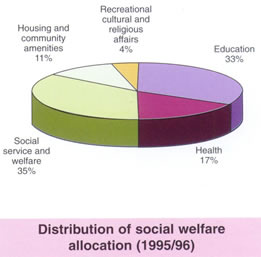 Mauritius
has established a comprehensive social welfare system with a wide range of assistance
schemes such as old age pensions, basic widow’s pensions, basic invalid pension
and other non-contributory social benefits to cater for the needy. There are programmes
for poverty alleviation to ensure that the poor are not excluded from the mainstream
of socio-economic development. The entire population has access to free medical
services that has resulted in a very significant improvement in the health status
of the population. Nearly 50% of the national budget is spent on the social sector.
The 1990 Population and Housing Census data indicated
a general improvement in the living conditions of the population. The number
of households having access to electricity and piped water has increased
markedly to reach more than 90% in 1995.
Education and Training
systems
The education system in Mauritius is a four-tiered
one, consisting of the pre-primary, primary, secondary and tertiary levels.
Mauritius is one of the few countries with free education from the pre-primary
to the tertiary levels. Primary education is obligatory for all children
between the ages of 4 and 11. Adult literacy rate is about 90%.
It should be noted that only 3% of the primary education
population reach the tertiary level in Mauritius and have the possibility
to study climate change issues. Such an important subject cannot be restricted
to such a small percentage of the student population.
The Ministry of Education and Human Resources is
laying strong emphasis to further promote science subjects at different
levels in the national curriculum. One of the main objectives of this policy
is to raise awareness on climate change issues.
Professional and Vocational training are offered
by other institutions which also raise public awareness on environment
and climate issues in relation to specific areas of interest.
Professional and Vocational training institutions:
-
Industrial Vocational Training Board IVTB
-
The Department of Environment DOE and its Information,
Education and Resources Division
-
National Parks and Conservation Service NPCS, forming
part of the Ministry of Agriculture, Fisheries and Co-operatives MOAFCOOP
-
Youth centres operating under Ministry of Youth and
Sports MYS
-
Mauritius Institute of Public Administration and Management
MIPAM
-
Mauritius College of the Air MCA
-
Mahatma Gandhi Institute MGI
MAURITIUS AT A GLANCE – 1995
Main Islands: Mauritius, Rodrigues,
Agalega, the Cargados carajos St. Brandon and the Chagos Archipelagos
Diego Garcia .
| Marine Exclusive Economic Zone |
2 000 000 km2 |
| TOTAL LAND AREA : |
2040 km2 |
| Mauritius Island Area : |
1865 km2 |
| Temperature Winter |
140 C 600 m to
240C coast |
|
Summer |
190 C 600 m to
340
C coast |
| Independence |
1968 12th March |
| Republic |
1992 12th March |
| Population |
1.1 Million |
| Population Growth rate |
1.2% |
| Population Density |
560 km-1 |
| Life expectancy at birth |
70 years |
| Adult literacy |
90% |
| GNP |
3424 US $ |
| Economic growth past decade |
6% |
| Crude death rate: |
6.7 per thousand population |
| Crude birth rate: |
18.2 per thousand population |
| Women participation rate 15 years and above |
35% |
The ECONOMY
Introduction
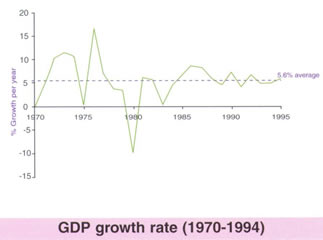
A quarter of a century ago, some eminent economists
rated quite bleakly the prospects for sustained development of the newly
independent Mauritius. The economic fortune of Mauritus was, however, cast
in other moulds. From an IDA-supported International Development Association
economy caught in the Malthusian trap of overpopulation, Mauritius went
on to record a robust average annual growth rate of 5.6% over the last
25 years. This sound performance has been attributed to many factors and,
in particular, to the privileged access to European markets through the
Lomé Convention and to the relentless commitment by successive governments
to a consistent programme of economic reform and liberalization.
 The
Mauritian economy has undergone several distinct development phases and
in the process, has successfully diversified from a mono-crop economy,
highly dependent on the export of sugar, into manufacturing exports, tourism
and more recently, services. With a per capita income of US $ 3442 in 1995
and a Human Development Index of 0.831, Mauritius was classified among
the upper-middle income countries.
In 1995, the economy recorded a stable growth rate
of 5.6%. The inflation rate was contained to a single-digit figure of 6%.
The consumption to GDP ratio stabilized at around 77% resulting in a savings
rate of 23% while the investment rate stood at 24%. On the international
side, the current account deficit was around US $ 21 M, equivalent to some
0.6% of GDP. The stock of foreign reserves was sufficient to cover six
months of imports. External debt stocks were relatively low at around 30%
of GDP.
|
MAURITIUS SELECTED ECONOMIC INDICATORS
|
| ITEM |
UNIT |
1992
|
1993
|
1994
|
1995
|
| 1.
Population Mid – year |
000 |
1084.4
|
1097.3
|
112.6
|
1122.1
|
| 2.
Per capita GNP |
MUR |
45770
|
51540
|
56321
|
60953
|
| 3.
GDP at current market prices |
MUR
M |
49633
|
56493
|
63106
|
68728
|
| 4.
GDP at current factory cost |
MUR
M |
42393
|
48068
|
54549
|
60370
|
| -
Breakdown as a % of total |
|
|
|
|
|
| Agric,
hunting, forestry, fishing |
% |
10.8
|
9.7
|
9.1
|
9.5
|
| -
Sugar |
% |
6.9
|
5.7
|
5.2
|
5.7
|
| Manufacturing |
% |
32.5
|
23.3
|
23.3
|
23.7
|
| -
EPZ |
% |
11.8
|
11.9
|
11.7
|
11.7
|
| Construction |
% |
7.2
|
7.4
|
7.4
|
6.7
|
| Wholesale,
Retail trade, Rest-& Hotels |
% |
16.6
|
17.1
|
17.0
|
17.0
|
| -
Rest-& Hotels |
% |
3.4
|
3.7
|
3.9
|
4.1
|
| 5.
GDP annual growth rate |
% |
6.7
|
4.9
|
5.3
|
5.6
|
| 6.
Gross Domestic Savings |
MUR
M |
12939
|
13933
|
14883
|
15766
|
| 7.
Savings Rate |
% |
26.1
|
24.7
|
23.6
|
22.9
|
| 8.
Investment GDFCF |
MUR
M |
13810
|
16065
|
19350
|
16750
|
| 9.
Investment Rate |
% |
27.8
|
28.4
|
30.7
|
24.4
|
| 10.
Exports f.o.b Includes re-exports |
MUR
M |
20744
|
23522
|
24697
|
27326
|
| -
Sugar as a % of total |
% |
28.2
|
24.5
|
23.2
|
23.2
|
| -
EPZ as a % of total |
% |
63.1
|
67.3
|
66.9
|
66.8
|
| 11.
Imports c.i.f |
MUR
M |
25280
|
30319
|
34548
|
34363
|
| 12.
Visible trade balance |
MUR
M |
- 4536
|
- 6797
|
- 985
|
- 7037
|
| 13.
Balance of payments |
MUR
M |
721
|
140
|
- 773
|
- 1895
|
| 14.
Foreign Exchange Reserves |
MUR
M |
14556
|
14145
|
14283
|
18604
|
| 15.
Total Labour Force |
000 |
453
|
464
|
476
|
485
|
| 16.
Employment March |
000 |
291.7
|
290.1
|
292.4
|
289.2
|
| -
Agriculture as a % of total |
% |
12.5
|
12.1
|
11.7
|
11.4
|
| -
Manufacturing as a % of total |
% |
40.7
|
39.6
|
38.4
|
38.1
|
| 17.
Unemployment |
000 |
15
|
18
|
21
|
24.5
|
| 18.
Unemployment rate |
% |
3.3
|
3.9
|
4.5
|
5.2
|
| 19.
Inflation rate |
% |
4.6
|
10.5
|
7.3
|
6.0
|
| 20.
Overall budget balance |
MUR
M |
- 1031
|
- 1458
|
- 2427
|
- 4090
|
| -
as a % of GDP |
% |
2.0
|
2.5
|
3.8
|
5.7
|
| 21.
Debt service ratio |
% |
8.9
|
7.2
|
8.4
|
7.7
|
| 22.
Tourism |
|
|
|
|
|
| -
Tourists arrivals |
000 |
335.4
|
374.6
|
400.5
|
422.5
|
| -
Gross tourism earnings |
MUR
M |
4655
|
5362
|
6415
|
7472
|
| 23.
Nominal Exchange rate Ann. Average |
MUR/US$ |
15.58
|
17.70
|
18.10
|
17.80
|
Agricultural
Sector
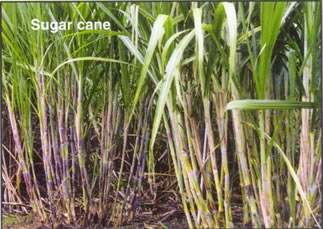
The Sugar industry has been the backbone
of the Mauritian economy since the dawn of our economic history. It is
still an important economic player, although in the diversification process
it has been overtaken by the manufacturing sector both in terms of export
earnings and employment. With a total cultivated area of 76 839 hectares
in 1995, it accounted for about 88% of total arable land, 7% of GDP and
about 13% of employment.
 The
sugar industry is expected to continue to be one of the important engines
of growth in the future because of preferential prices on guaranteed markets.
Mauritius has an ACP quota of 507 000 tonnes of sugar with the European
Union under the Sugar Protocol and 13 000 tonnes with the USA. In June
1995, Mauritius benefited from an additional quota of 85 000 tons for the
period July 1995 to June 2001 under the Special Preferential Agreement.
Manufacturing
Sector
 The
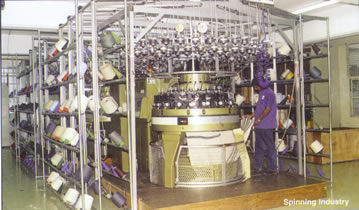
major driving force of the Mauritian economy since the mid 1980s has been
the manufacturing sector. The rapid growth in this sector was concentrated
in the Export Processing Zone EPZ which now produces around 50% of total
manufacturing value added. In 1995, the EPZ contributed to 10.3% of GDP,
to some 28% of total employment and 70% of foreign earnings. EPZ production,
growing at an average rate of 12%, is dominated by textiles and garments
which account for 85% of total EPZ employment and 75% of EPZ export earnings.
Tourism Sector
 The
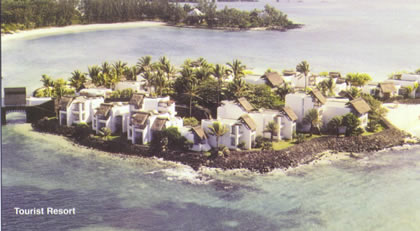
tourism industry has established itself as another of the main cylinders
of growth. In 1995, tourist earnings grew by 9%, representing some 15%
of total foreign exchange earnings. Our main source markets for the tourist
sector continue to be Europe 55% followed by Réunion Island 19%
and South Africa 10%. The number of tourist arrivals followed its upward
trend to cross the 400 000 mark in 1995. Mauritius will continue to promote
itself as a quality destination catering to the long haul high-spending
end of the market.
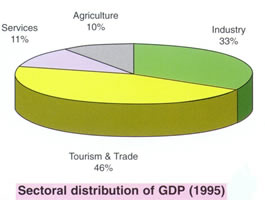
Quatenary Sector
The quatenary sector, comprising the new
high-tech international financial services such as offshore banking, freeport,
fund management, stock exchange, insurance, etc., has emerged to
be a vital contributor to the Mauritian economy and is now considered as
the fourth pillar. Its contribution to GDP, around 11%, is almost as high
as that of the EPZ and higher than that of the agricultural sector. The
quatenary sector registered an annual growth rate of around 9% over the
past few years.
 Within
the high-value added quatenary sector, the Offshore Business Centre has
given a whole new shape to the structure of the Mauritian financial system
and broadened the scope for financial activities. Mauritius has thus carved
a comfortable niche in the world of international financial services and
has acquired the stature of a trustworthy, stable and reputable offshore
jurisdiction, with a total of 3279 offshore entities, including seven offshore
banks.
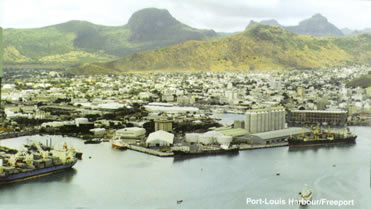
 The
Mauritius Freeport, created in 1992, has also witnessed an impressive growth
performance with a turnover of about $ 49.06 million in 1995. The major
activities of the free port are, inter alia, warehousing and storage, labelling,
packing, breaking bulks and other minor processing. The number of registered
free port companies in 1995 amounted to 121 and the number of licenses
issued by the Mauritius Freeport Authority was 309 for the same year. Mauritius
is now well poised to be Africa’s major regional free port centre and the
ideal trans-shipment port to interface the growth centres of Asia to the
burgeoning economies of the African continent.
External trade
and Regional cooperation
External trade
Mauritius has a small, open and liberalized economy
depending on international trade. Imports and exports constitute a major
part of its economic activities and Europe remains one of its main trading
partners.
Total exports grew by 12.5% in value terms to $ 1
535 million in 1995. The most important commodity in its export basket
is manufactured products, representing more than 70% of total merchandise
exports, followed by sugar, accounting for 25%.
Imports, in nominal terms, rose to $ 1 931 million
in 1995. Food 16%, machinery 22% and manufactured goods 33% constituted
the main items of our imports.
Regional cooperation
Mauritius is conscious that regional initiatives
and markets offer avenues for overcoming the constraints of smallness and
remoteness and do present possibilities for its entrepreneurs to achieve
the necessary economies of scale. Mauritius has been a signatory to many
regional agreements, namely the Lomé Convention, IOC, COMESA, SADC
and more recently the IOR-ARC.
Intra-regional trade in both SADC and COMESA has
increased considerably. Mauritian exports to SADC countries went up by
about 15% in 1995 while exports to COMESA countries experienced a 10% boost
to cross the MUR 1 billion mark. Imports from SADC and COMESA countries
amounted to $ 230 million and $ 57.5 million respectively, the latter representing
an increase of almost 25%.
Economic activities of
the outer islands
Rodrigues is mainly agricultural. About 35% of its
area is devoted to rearing of cattle, sheep and goats. The main crop is
maize which is used as staple food and for feeding animals. Lemons and
chillies are also economically important. Fishing is also an important
feature of life and is practised in the lagoons and offshore coastal waters.
Manufacturing industries, except handicrafts are absent.
The main activities of Agalega and St Brandon islands
are copra production and fisheries.
ENERGY
Primary energy
Indigenous energy resources of Mauritius are limited
and consist mainly of biomass, hydro and fuelwood since the country has
no known reserves of oil, gas or coal and no refinery. The country's requirements
depend mainly on imported energy carriers. During the last ten years, the
energy sector has witnessed sustained increase in primary energy, used
mainly for industrial, transport, commercial and domestic sectors. The
total primary energy requirements of Mauritius vary significantly and depend
on the volume of bagasse, a by-product of the sugar industry, available
for power generation by sugar factories. There are currently no major economic
uses for bagasse other than power generation.
In 1995, petroleum products accounted for 58.2% of
total primary energy followed by bagasse 32.5%, coal, 4.8% and hydro and
fuelwood, 4.5%. Consumption of petroleum products was dominated by four
types of fuels namely fuel oil, dual purpose kerosene, gasoil and light
petroleum gas Lpg and their total imports reached 725 000 t in 1995.
Energy transformation
and production
The lack of fossil energy carriers strongly characterized
the energy transformation processes which means that non-indigenous carriers
are imported in the form of their final use.
Energy conversion consists of four transformation
segments namely:
-
generation of electricity in oil-based power stations
-
production of steam and generation of electricity from
bagasse
-
transformation of coal into electricity and
-
production of small amounts of charcoal from fuel wood.
The Central Electricity Board CEB is the body, responsible
for the production and distribution of electricity. It had an installed
capacity of 365 MW of which the available capacity was limited to 312 MW
because of permanent deratings due to ageing and other operational constraints.
CEB operates eight hydroelectric plants with a combined capacity of 60
MW of which 15 MW can be considered firm. It also operates three heavy
fuel power plants with an installed capacity of 173 MW and a kerosene fired
gas turbine power station of 80 MW capacity. Thirteen sugar factories having
an installed capacity of 52 MW, also provide surplus electricity to the
CEB grid.
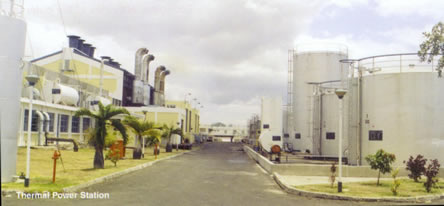 The
thermal power stations using imported fuel oil produced 788 GWh representing
75% of electricity generated in 1995. The hydro-power plants accounted
for 13% and the sugar factories 12%.
The most plentiful indigenous source of energy is
bagasse. The seasonality and variability in sugar production require power
plants at sugar mills to use the dual fuel system bagasse-cum-coal to
supply power to the grid at guaranteed levels all year round.
The hydroelectric potential of the country has largely
been developed. The installed capacity of the plants in 1995 was about
60 MW. During the past ten years, output from hydro generation has been
uneven, varying between 75 GWh and 148 GWh. The average annual output has
been 108 GWh equivalent to about 24 000 tonnes of oil. The medium - to
longer term prospects are that hydro generation
would stagnate at around 130 GWh annually,
Consumption
Final energy consumption in 1995 was 758 000 TOE.
The share of petroleum products in the final energy consumption was 39%
while that of electricity was 27%. The share of bagasse, a renewable source,
in total final energy consumption dropped to 30% since the amount of bagasse
used was almost constant.
Energy consumption in 1995 TOE
| Primary energy requirement |
805 993
|
|
of which : petroleum products
|
469 109 |
| Per Capita primary energy
requirement |
0.72
|
| Final energy use |
758 303
|
|
of which : Petroleum products
|
295 688 |
|
Bagasse
|
230 787 |
|
Electricity
|
205 666 |
|
Coal
|
20 334 |
The final energy consumption in the industrial sector
including sugar accounted for 51%, domestic, 16%, transport, 25% and the
commercial sector 7%. If bagasse used in the sugar industry was excluded,
the percentage share would have been transport 36%, industry 29%, domestic
23% and the commercial sector 10%. The shift in the structure of final
energy use from commercial and domestic sectors to industry and transport
is noteworthy.
The total energy available from indigenous resources
satisfied about 37% of the total energy demand. In 1995, there was still
a high dependence on petroleum products and coal imports. The imports of
primary energy increased to 776 000 TOE. Domestic consumption accounted
for 620 000 TOE 80% and the remaining 20% were used for bunkering. Coal
imports increased to 41 000 TOE.
Electricity sales GWh
| Sector |
1995 |
| Domestic |
334.1 |
| Commercial |
229.6 |
| Industrial General |
229.6 |
| Industrial General |
308.4 |
| Agriculture Irrigation |
17.3 |
| Other |
14.6 |
The total supply of forest products and waste wood
was estimated at 22 000 t of which 9900 t qualified as fuelwood. The contribution
of other renewable sources of energy such as solar radiation was very low
and restricted to the use of water heating devices.
TRANSPORT
The transportation sector can be divided into three
main categories namely:
-
agricultural
-
commercial
-
passenger transport.
The total demand for transport in 1995 was 25 million
tonnes of freight and 259 million passengers.
 Essential
travel for attending work or school represent 65% of the total passenger
volume. The modal share in 1995 was 67% for buses, 27% for private cars
and dual purpose vehicles DPV and 6% for motorcycles.
As for freight transport, there is a tendency towards
the use of vehicles with higher payloads in order to cater for bulk transportation
and containerization to benefit from economies of scale. There is a large
number of small trucks in use to satisfy the demand in the industrial and
distributive trade sectors.
As a result of an increase in mobility and government
decision to grant custom duty concessions on the purchase of utility vehicles,
cars and motorcycles, the vehicle fleet has grown at an average rate of
7% yearly. In 1995, the registered vehicle population was 191 000.
Distribution of vehicles in 1995
| Type of vehicle |
Number
|
| Light and heavy trucks |
19 665
|
| Buses |
2660
|
| Cars and DPVs |
64 375
|
| Motorcycles |
97 810
|
| Tractors and trailers |
6490
|
All gasoline and about 44% of imported diesel
were used in the transportation sector in 1995.
LAND
USE CHANGE AND FORESTRY
Land is a basic natural resource and is essential
to sustainable development. It provides food, fodder, energy, settlements
and industries. The growth in population, industrialization and urbanization
has brought considerable changes in land use and hence cover. Land is being
increasingly subjected to degradation due to lack of proper management
stragtegies. Sustainable land development is crucial, especially for small
island countries like Mauritius.
Land use change
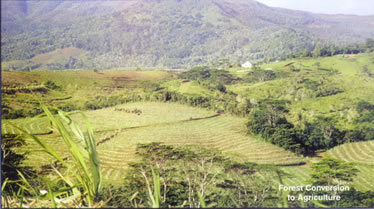 Mauritius
was once a dense tropical forest and the arrival of man with his needs
has changed this situation over time. Actually the island of Mauritius
has about 46% of its land under agriculture and 31% constitutes forest,
shrubs and grazing land areas with the remaining 23% devoted to settlements,
infrastructure and inland water resource systems.
Land use Distribution
in 1995
Areaha
%
Sugar cane plantations
76 840 41
Tea plantation being replaced by sugar cane
3660
2
Forests, shrubs and grazing land
57 000 31
Other agricultural activities
6000
3
Infrastructure
4000
2
Inland water resource systems
2600
1
Built-up areas
36 400 20
Forestry
The present total area of forest land is estimated
at about 57 059 ha, of which 22 519 ha are state owned with the rest private.
Distribution and classification of forest lands
in 1995 ha
|
State Forest lands
|
|
| Planted |
12 859
|
|
| Natural : Indegenous |
4 815
|
|
| Others |
4 845
|
|
|
Total
|
22 519
|
|
|
|
|
Private Forest lands
|
|
| Mountain reserves |
3 800
|
|
| River reserves |
2 740
|
|
| Others incl. scrubs and grazing
land |
28 000
|
|
|
Total
|
34 540
|
| Grand Total |
57 059
|
Each year some 200 ha of forest are cut down for
domestic use and equivalent felled areas are replanted.
BIODIVERSITY
Prior to the arrival of man, Mauritius was home to
a rich diversity of indigenous flora and fauna, of which most have now
disappeared. Today less than 1% of the original indigenous vegetation remains
and these areas have been declared as Nature Reserves.
Birds and bats, the only mammals before the arrival
of man and a few hardy land animals established themselves to evolve into
unique species on the island. With very few predators the birds which have
aririved on the island also evolved into highly unusual and unique forms.
There has been a drastic decline in populations of
endemic birds, reptiles and other animals, many of which are on the verge
of extinction. Mauritius has the third largest number of threatened animal
species in the world due to human activity.
List of endangered animal species in Mauritius
| Common name |
Biological
name |
Status |
| Echo Parakeet |
Psittacula
echo |
Critical |
| Mauritius Fody |
Foudia rubra |
Very rare |
| Olive White-eye |
Zosterops
chloronothos |
Very rare |
| Cuckoo Shrike |
Coracina typica |
Rare |
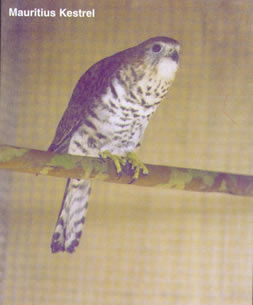
| Mauritius Kestrel |
Falco punctatus |
Endangered |
| Pink Pigeon |
Neseona mayeri |
Endangered |
| Rodrigues Fruit
Bat |
Pteropus rodricensis |
Endangered |
| Rodrigues Warbler |
Brebornis
rodricanus |
Very rare |
The flora consists of more than 900 species, of which
over 300 are endemic. Many of these endemic species are today on the highly
endangered list, with some of them surviving singly or as a small population.
Some of the endangered floral species today include the black ebony, Royal
Palm, Bottle Palm, Hurricane Palm, the Sideroxylon shrub, Gagnebina
pterocarpa, Lomatophyllum tormentum, Bois de chandelle Dracaena
cuncinna, Bois de boeuf Gastonai mauritiana, an orchid Oeniella
aphrodite, cafe marron Ramosmania heterophylla, Bois pipe
Dombeya rodriguensiana and Gonania leguatii.
The twenty rarest plants of Mauritius
| Plant Species |
Status |
| Dombeya mauritiana |
Only 1 plant
in Magenta |
| Olax psittacorum |
Only 1 plant
in the lowland |
| Albizzia vaughanii |
Only 1 plant
in Tamarin |
| Badula reticulata |
Known from 1
locality only |
| Tambourissa
tetragona |
Known from 1
locality only |
| Claoxylon
linostachys |
Only 2 plants |
| Chionanthus
boutonii |
Only 2 plants
in Perrier |
| Hibiscus fragilis |
Only 2 plants
in Corps de Garde |
| Tambourissia
cocottensis |
Known from 1
locality |
| Cylindrocline
commersonii |
Small localized
population |
| Elaeocarpus
bojeri |
Small localized
population |
| Croton vaughanii |
Small localized
population |
| Embellia micrantha |
Very rare in
Mauritius |
| Faujasia reticulata |
Information not
available |
| Diospyros
hemiteles |
Small population |
| Xylopia amplexicaulis |
Very rare |
| Drypetes caustica |
Small localized
population |
| Tetrataxis
salicifolia |
Only 2 small
populations |
| Gaertnera
longifolia |
Very rare; only
few plants |
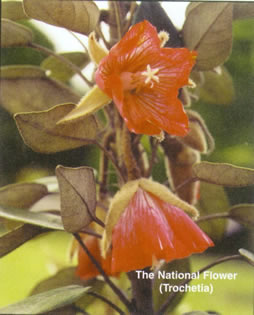
| Trochetia
boutoniana |
Small localized
population |
 The
Republic of Mauritius consists of a main island, Mauritius, and a group
of small islands scattered in the South West Indian Ocean namely: Rodrigues, the
Cargados carajos St. Brandon, Agalega, Tromelin and the Chagos Archipelago Diego
Garcia. The total land area of the Republic of Mauritius is 2040 km2.
It is surrounded by coral reefs and is situated at about 2000 km off the East
coast of Africa.
  Mauritius,
an Indian Ocean island, is situated between latitudes 19°50’ south and 20°30’
south, and between longitudes 57°18’ east and 57°46’ east. It has a surface
area of 1865 km2. The Island consists of an irregular
Central Plateau surrounded by mountain ranges and plains. The Central Plateau
has a mean elevation of about 300-400 m and rises to a maximum height of about
600 m in the South of the Island, the highest peak being 828 m. The Island is
the result of four major volcanic activity periods between 7.8 million and 25
000 years ago.
 Rodrigues
lies between latitudes 19°40’ and 19°46’ south and longitudes 63°20’
and 63°30’ east at about 720 km to the North East of Mauritius. It is the
youngest of the Mascarene islands, is hilly and rocky with the highest peak rising
to about 398m. Like Mauritius, it is made up of basaltic lavas but is also covered
by volcanic dust in some areas. There are small areas in the South and the East
where sand blown by wind has accumulated to form limestone rocks. Caves are found
in these areas.
  St
Brandon forms part of the Cargados Carajos shoals that are made up of numerous
sand banks and are situated about 350 km off the North North-East of Mauritius.
The main islet, Raphael island, lies at latitude 16°27’ south and longitude
59°36’ east. These sand banks undergo marked changes in their shorelines under
the effects of extreme weather.
  Agalega
is made up of two small islands: North and South Islands, found approximately
1000 km north of Mauritius. The two islands are separated by a strip of shallow
water about 1 km wide. At low tide, it is possible to walk from one island to
the other. North Island lies between latitudes 10°20’ and 10°25’ south
and longitudes 56°34’ and 56°38’ east. It has an elongated shape, extending
along a northwest-southeast axis and is approximately 1 km wide. South Island
also extends in a northwest-southeast axis, is pear-shaped and lies between latitudes
10°26’ and 10°28’ south and longitudes 56°39’ and 56°42’ east.
It is about 2 km at its widest part.
 In
their quest to control the route to the east the British conquered the island
from the French in 1810. Inclusion in the British empire did not affect the country’s
agriculture, culture and laws, as agreed under the Treaty of Paris signed in 1814,
and English became the official language in 1827. After the abolition of slavery
in 1835, indentured labourers were brought in from India to work in the cane plantations.
A period of continuous infrastructural development followed alongside the expansion
of the sugar industry. The end of the 19th century saw a
continuous struggle for social and economic emancipation that resulted in the
establishment of health and educational facilities. These socio-economic improvements
prepared the population and paved the way towards Independence. Mauritius and
its outer islands became Independent on 12 March 1968 and was proclaimed a Republic
in March 1992.
  The
Mauritius Independence Order, which established a self-governing state, came into
force on 12 March 1968, and was subsequently amended. Constitutional amendments
providing for the adoption of republican status were approved by the Legislative
Assembly henceforth known as the National Assembly on 10 December 1991, and came
into effect on 12 March 1992. The main provisions of the revised Constitution
are:
 Mauritius
receives an annual average of 2100 mm of rain with about 70% of it occurring
in summer. Strong insolation, light winds and moist and unstable airmass
are the prerequisites for cloud development. Violent thunderstorms accompanied
by heavy downpours commonly occur.

 Short
wave solar radiation varies from about 14 MJ m-2
day-1 in the uplands to about 19 MJ m-2
day-1 in the northern plains, i.e. from about
5000 to 7000 MJ m-2 year-1.
The lowest amount of solar radiation is received during the month of June for
most sites while the highest amount is received in December-January.
  At
the end of 1995 the population of the Republic of Mauritius was estimated at 1
129 428 of whom 564 996 were males and 564 432 females. With 560 persons per km2,
the country ranks high in population density. Urban population represents about
43.5% of the total population.
 Mauritius
has established a comprehensive social welfare system with a wide range of assistance
schemes such as old age pensions, basic widow’s pensions, basic invalid pension
and other non-contributory social benefits to cater for the needy. There are programmes
for poverty alleviation to ensure that the poor are not excluded from the mainstream
of socio-economic development. The entire population has access to free medical
services that has resulted in a very significant improvement in the health status
of the population. Nearly 50% of the national budget is spent on the social sector.
 The
Mauritian economy has undergone several distinct development phases and
in the process, has successfully diversified from a mono-crop economy,
highly dependent on the export of sugar, into manufacturing exports, tourism
and more recently, services. With a per capita income of US $ 3442 in 1995
and a Human Development Index of 0.831, Mauritius was classified among
the upper-middle income countries.
 The
sugar industry is expected to continue to be one of the important engines
of growth in the future because of preferential prices on guaranteed markets.
Mauritius has an ACP quota of 507 000 tonnes of sugar with the European
Union under the Sugar Protocol and 13 000 tonnes with the USA. In June
1995, Mauritius benefited from an additional quota of 85 000 tons for the
period July 1995 to June 2001 under the Special Preferential Agreement.
 The
major driving force of the Mauritian economy since the mid 1980s has been
the manufacturing sector. The rapid growth in this sector was concentrated
in the Export Processing Zone EPZ which now produces around 50% of total
manufacturing value added. In 1995, the EPZ contributed to 10.3% of GDP,
to some 28% of total employment and 70% of foreign earnings. EPZ production,
growing at an average rate of 12%, is dominated by textiles and garments
which account for 85% of total EPZ employment and 75% of EPZ export earnings.
 The
tourism industry has established itself as another of the main cylinders
of growth. In 1995, tourist earnings grew by 9%, representing some 15%
of total foreign exchange earnings. Our main source markets for the tourist
sector continue to be Europe 55% followed by Réunion Island 19%
and South Africa 10%. The number of tourist arrivals followed its upward
trend to cross the 400 000 mark in 1995. Mauritius will continue to promote
itself as a quality destination catering to the long haul high-spending
end of the market.
 Within
the high-value added quatenary sector, the Offshore Business Centre has
given a whole new shape to the structure of the Mauritian financial system
and broadened the scope for financial activities. Mauritius has thus carved
a comfortable niche in the world of international financial services and
has acquired the stature of a trustworthy, stable and reputable offshore
jurisdiction, with a total of 3279 offshore entities, including seven offshore
banks.
 The
Mauritius Freeport, created in 1992, has also witnessed an impressive growth
performance with a turnover of about $ 49.06 million in 1995. The major
activities of the free port are, inter alia, warehousing and storage, labelling,
packing, breaking bulks and other minor processing. The number of registered
free port companies in 1995 amounted to 121 and the number of licenses
issued by the Mauritius Freeport Authority was 309 for the same year. Mauritius
is now well poised to be Africa’s major regional free port centre and the
ideal trans-shipment port to interface the growth centres of Asia to the
burgeoning economies of the African continent.
 The
thermal power stations using imported fuel oil produced 788 GWh representing
75% of electricity generated in 1995. The hydro-power plants accounted
for 13% and the sugar factories 12%.
 Essential
travel for attending work or school represent 65% of the total passenger
volume. The modal share in 1995 was 67% for buses, 27% for private cars
and dual purpose vehicles DPV and 6% for motorcycles.
 Mauritius
was once a dense tropical forest and the arrival of man with his needs
has changed this situation over time. Actually the island of Mauritius
has about 46% of its land under agriculture and 31% constitutes forest,
shrubs and grazing land areas with the remaining 23% devoted to settlements,
infrastructure and inland water resource systems.
