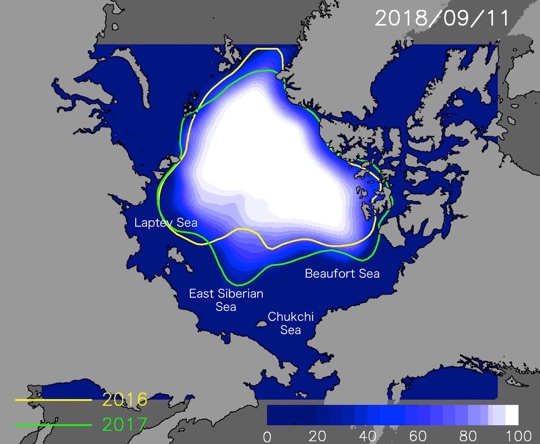
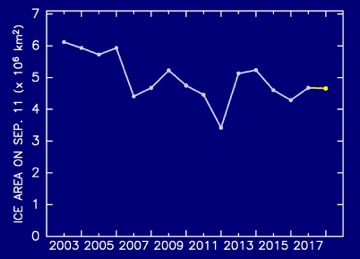
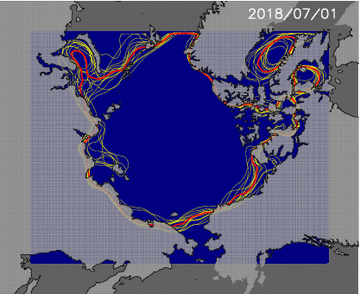
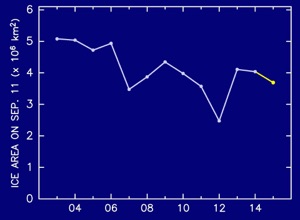
1. 1.Minimum ice extent in September will be about 4.66 million square

    kilometer.


2. Sea ice area will retreat with nearly same speed as last year.


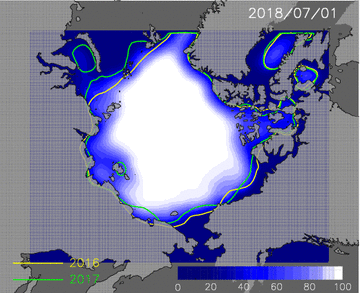
  1. 3.Sea routes of Russian side and Canadian side will both open.

    Russian side will open around August 15, and the Canadian side

    except for Canadian archipelago will open around July 15.

Method of this Prediction

Figure1:Predicted sea ice cover on September 11, 2018.

Figure 3:Animation of predicted Arctic ice extent from the July 1 to the September 20. Yellow and green lines indicates the ice edge of the same day for 2016 and 2017.

Sea ice extent on September 11, which is the minimal phase of Arctic sea ice, is expected to be 4.66 million square kilometer, which is 1.7% smaller than the last year’s minimum area.


Sea ice cover in the Laptev and East Siberian Seas will retreat with nearly same speed as last year. Sea routes of the Russian side will open around August 15, which is faster than the last year.


Sea routes of the Canadian side except for Canadian archipelago will open around the July 15.


Minimum sea ice cover in September of this year will be very similar to that of the last year.


※Prediction map is also available in Arctic Data Archive System of National Institute of Polar Research.

Figure 2:The interannual change of minimum extent since 2003. Value of 2018 is predicted one.

This prediction is based on our recent research (Kimura et al., 2013) showing a relationship between winter ice motion and summer ice cover. First, we estimate the ice thickness in spring from the movement of sea ice from December to April. Then, we predict the summer ice area depending on the assumption that thick ice remains later and thin ice melts sooner than the average.


To calculate the movement of the sea ice, we distributed particles over the ice cover on December 1, and traced the trajectories of the particles to the end of April, by using the satellite derived daily ice velocity (Figure 5). Data from satellite microwave sensors AMSR-E (2002/03- 2010/11) and AMSR2 (2012/13- 2016/17) was used to derive the daily ice velocity. We also considered initial ice thickness for each particle on December 1 calculated by the method of Krishfield et al. (2014). Based on the linear relationship between the thickness-weighted particle concentration on April 30 and sea ice concentration on a specific day in summer, we predicted the ice area on the specific day in this summer.

Figure 5:Animation of distributed particles’ movements during December 1, 2017 through April 30, 2018. The color bar indicates the thickness of the ice on December 1, 2017.

Figure 4:Animation of the ice edge (30% of ice concentration) for 2003-2017 (yellow contours) and 2018 (predicted: red contour).

Arctic Sea Ice Forecast 2018


First Report:May 17, 2018


Noriaki Kimura, Hiroyasu Hasumi


Atmosphere and Ocean Research Institute, The university of Tokyo

If you have any questions, please contact kimura_n@aori.u-tokyo.ac.jp

This work was partly supported by

Arctic Challenge for Sustainability Project.

References

Kimura, N., A. Nishimura, Y. Tanaka and H. Yamaguchi, Influence of winter sea ice motion on summer ice cover in the Arctic, Polar Research, 32, 20193, 2013.


Krishfield, R. A., Proshutinsky, A., Tateyama, K., Williams, W. J., Carmack, E. C., McLaughlin, F. A., and Timmermans, M. L., Deterioration of perennial sea ice in the Beaufort Gyre from 2003 to 2012 and its impact on the oceanic freshwater cycle, J. Geophys. Res., 119, 1271-1305, doi:10.1002/2013JC008999, 2014.


---------------