Arctic Sea Ice Forecast 2019
Third Report:July 29, 2019
Noriaki Kimura, Hiroyasu Hasumi
Atmosphere and Ocean Research Institute, The University of Tokyo
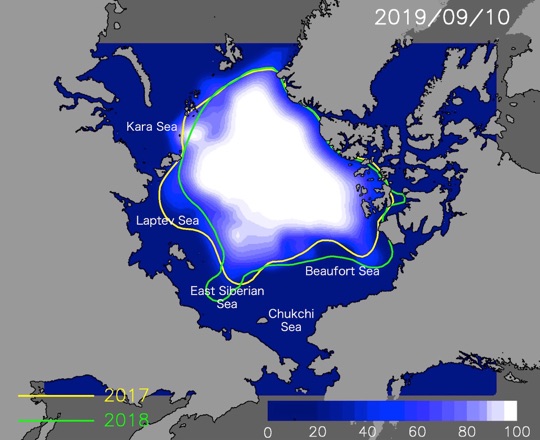
Figure1:Predicted sea ice cover on September 10, 2019.
-
1.Minimum ice extent will be about 4.56 million square kilometers.
-
2.Ice retreat in the Chukchi-Beaufort Sea and New Siberian Islands will be faster than a normal year.
-
3.Ice retreat around the Severnaya Zemlya will be slower than a normal year.
-
4.Sea routes of Russian side will open around August 10.
This work was supported by
Arctic Challenge for Sustainability Project.
If you have any questions, please contact kimura_n@aori.u-tokyo.ac.jp
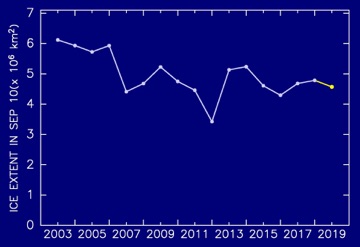
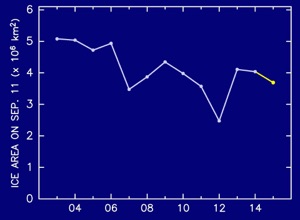
Figure 2:The interannual change of minimum extent since 2003. Value of 2019 is predicted one.
Figure 3:Animation of predicted Arctic ice extent from the August 1 to the September 20. Yellow and green lines indicates the ice edge of the same day for 2017 and 2018.
Figure 4:Animation of the daily anomaly of the predicted ice concentration from 2003-2018 mean. Red color shows the area of faster ice retreat.
Sea ice extent on September 10 is expected to be 4.56 million square kilometers, which is 4.6% smaller than the last year’s minimum area.
Ice retreat in the Chukchi Sea and Beaufort Sea will be faster than a normal year. Sea routes of the Canadian side except for Canadian archipelago is already open.
Ice retreat in the Laptev Sea and New Siberian Islands (Islands between the East Siberian Sea and Laptev Sea) will be faster than a normal year. On the other a hand, the retreat speed around the Severnaya Zemlya (Islands between the Kara Sea and Laptev Sea) will be slower than a normal year. Sea route of the Russian side will open around August 10.
Multi-year ice is distributed in Greenland-Canadian Archipelago side and Central of the Beaufort Sea. This pattern will be maintained during this summer.
-----
For this prediction, we used the sea ice data from satellite microwave sensors AMSR-E and AMSR2, and the relationship between the winter ice motion and summer ice concentration (Kimura et al., 2013). In this second report, we use the data until July 15.
-----
Ice prediction map is also available in Arctic Data Archive System of National Institute of Polar Research.
Figure 5: Animation of the predicted sea ice cover and multi-year ice distribution.