Method of Prediction: Difference from the first report
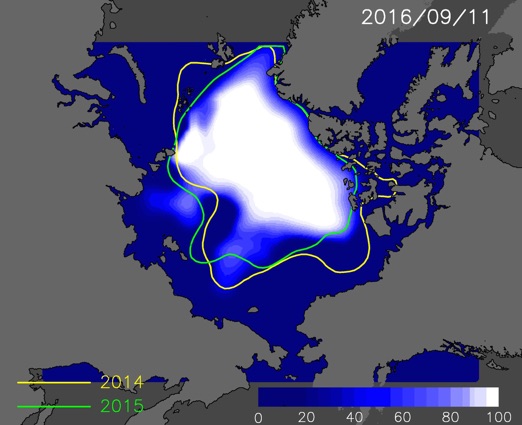
Figure1:Predicted sea ice cover on September 11, 2016.
Figure 3:Animation of predicted Arctic ice extent from the August 1 to the November 1. Yellow and green lines indicates the ice edge of 2014 and 2015.
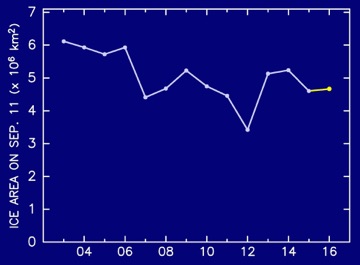
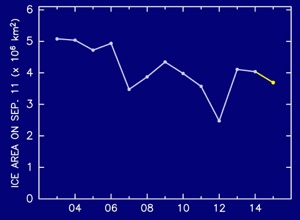
Figure 2:The interannual change of minimum extent since 2003. Value of 2015 is predicted one.
If you have any questions, please contact kimura_n@aori.u-tokyo.ac.jp
This work was partly supported by
Arctic Challenge for Sustainability Project.
This prediction used data from satellite microwave sensors AMSR-E and AMSR2. We analyzed the ice motion from December 1 up to April 30 and ice thickness on December 1, as same as the first report prediction.
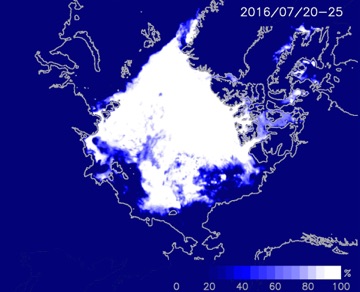
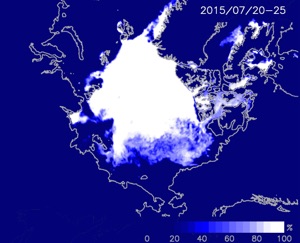
In addition to the method for the first report, sea ice concentration during July 20-25 is used for the prediction. Sea ice cover in the Arctic starts retreating in May; interannual difference in the shape of ice cover becomes obvious after it. We found that sea ice concentration after May correlates strongly with that In summer.
In this report we are showing the predicted ice cover by the multiple regression analysis based on the ice motion during December-April, and average sea-ice concentration during July 20-25.
-----
In this year, sea ice near the Canadian side and Atlantic side retreats rapidly compared with 2015 and 2014. On the other hand, the East Siberian Sea ice melts slowly. These features agree well with our prediction in the first and second reports.
In this updated prediction, the ice cover in the East Siberian Sea retreats more slowly than the first and second reports.
1. The minimum extent in September will be about 4.6 million square kilometer,
which is a little larger than the last year.
2. The sea routes of Russian side will open at the beginning of September.
On the Russian side, sea ice in the Laptev Sea is expected to be thin and retreat quickly. On the other hand, sea ice in the East Siberian Sea is likely to retreat slowly. The ice retreat in the East Siberian Sea will be late compared with the last year because the area is covered by thicker ice that was piled up by the winter convergence of sea ice. The sea routes of the Russian side will open at the beginning of September.
On the Canadian side, sea ice in summer is expected to be thin and retreat more quickly than the last year. The sea routes of the Canadian side except for Canadian archipelago has already opened.
The whole Arctic ice area in the minimum season will be a little larger than the last year. Sea ice extent on the September 11, which is the minimal area phase of Arctic sea ice, is expected to be about 4.6 million square kilometer.
※Prediction map is also available in Arctic Data Archive System of National Institute of Polar Research.
Arctic Sea Ice Forecast 2016
Third Report:July 29, 2016
References
Kimura, N., A. Nishimura, Y. Tanaka and H. Yamaguchi, Influence of winter sea ice motion on summer ice cover in the Arctic, Polar Research, 32, 20193, 2013.
Krishfield, R. A., Proshutinsky, A., Tateyama, K., Williams, W. J., Carmack, E. C., McLaughlin, F. A., and Timmermans, M. L., Deterioration of perennial sea ice in the Beaufort Gyre from 2003 to 2012 and its impact on the oceanic freshwater cycle, J. Geophys. Res., 119, 1271-1305, doi:10.1002/2013JC008999, 2014.
---------------

Noriaki Kimura, Hiroyasu Hasumi
Atmosphere and Ocean Research Institute, The university of Tokyo
Figure 4:Mean ice concentration during July 20-25, 2016.
Figure 5:Mean ice concentration during July 20-25, 2015.
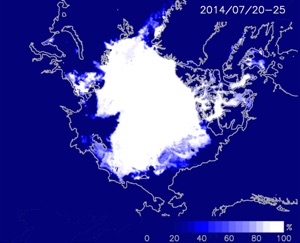
Figure 6:Mean ice concentration during July 20-25, 2014.