Graph: NCL
Acknowlegement
"NCL is an interpreted language designed specifically for scientific data analysis and visualization" and has been developed by NCAR. Following scripts were constructed based on the knowledge gained from the NCL web site (NCL web page). We thank the development team to make NCL available to us.
Terms and conditions of use
We have no responsibility or liability for any unintended consequences or damages that the use of the following scripts may cause. Please use them at your own risk.
Examples
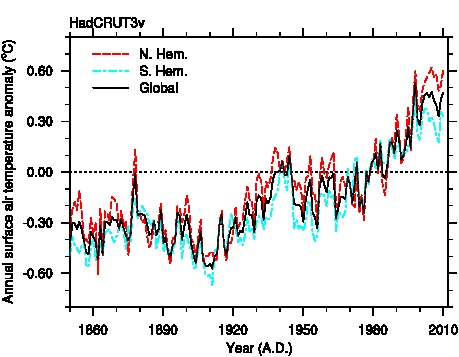
Time series
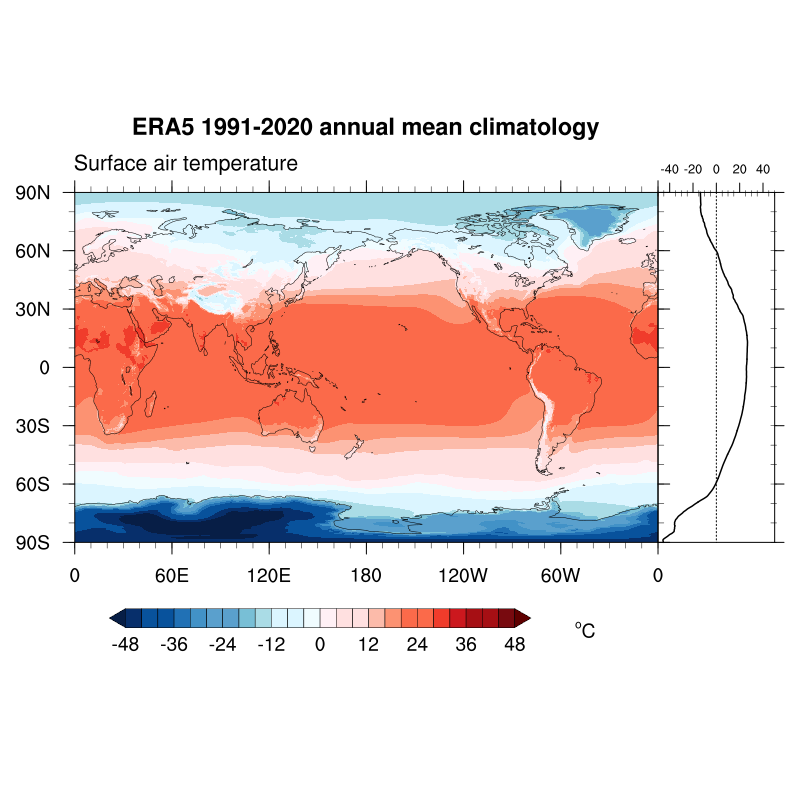
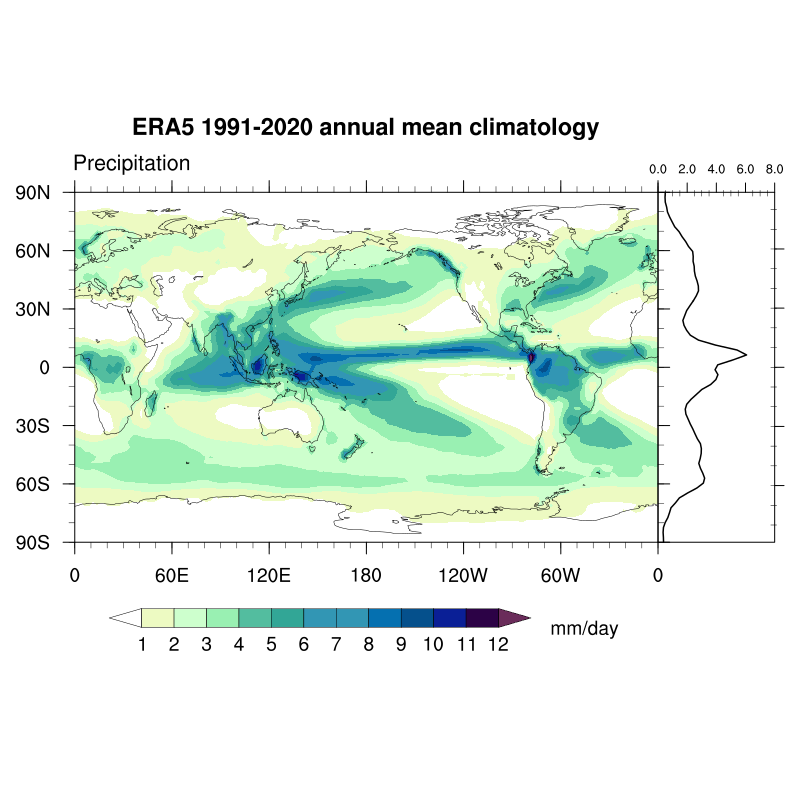
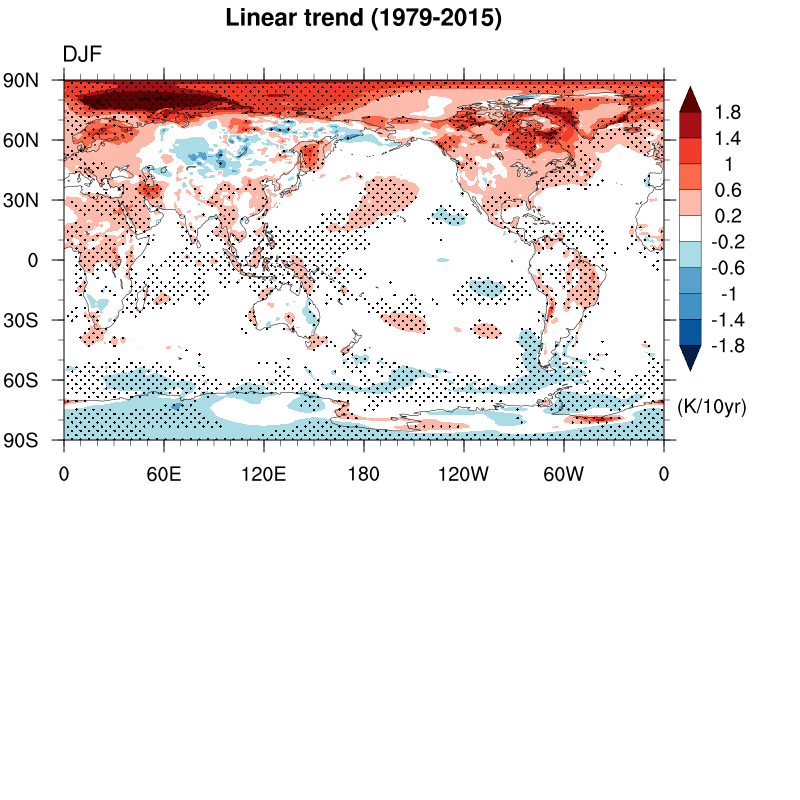
Latitude plot
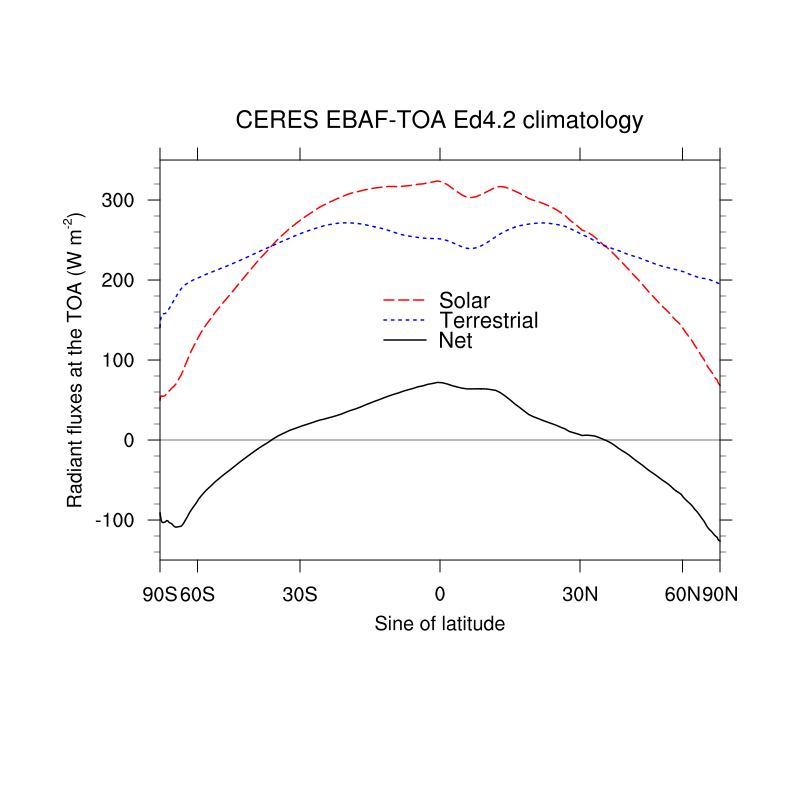
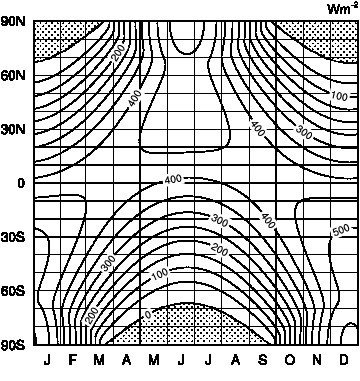
- Energy balance at the top of atmosphere (Figure)
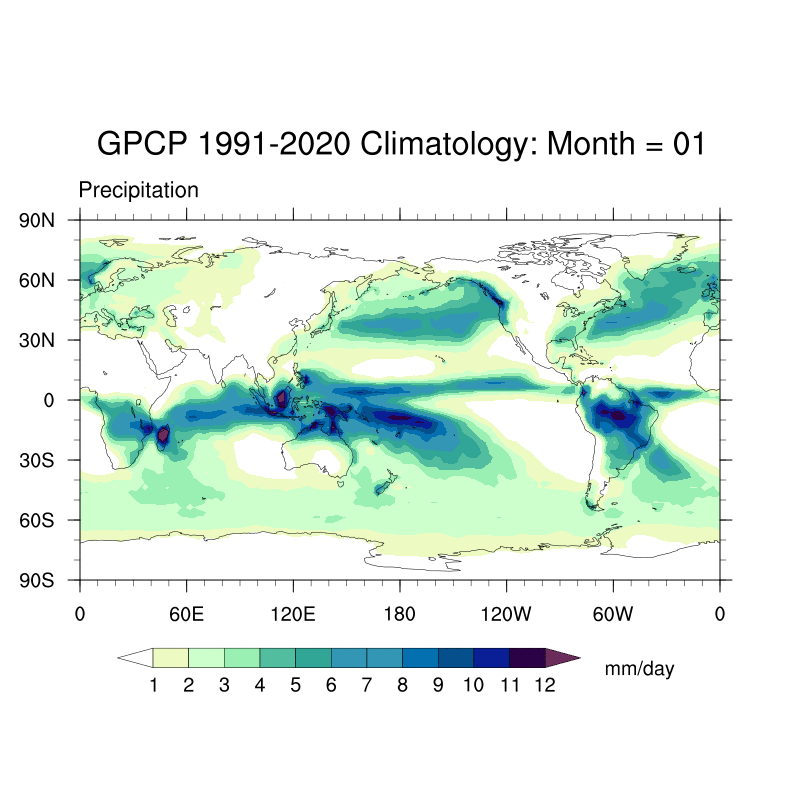
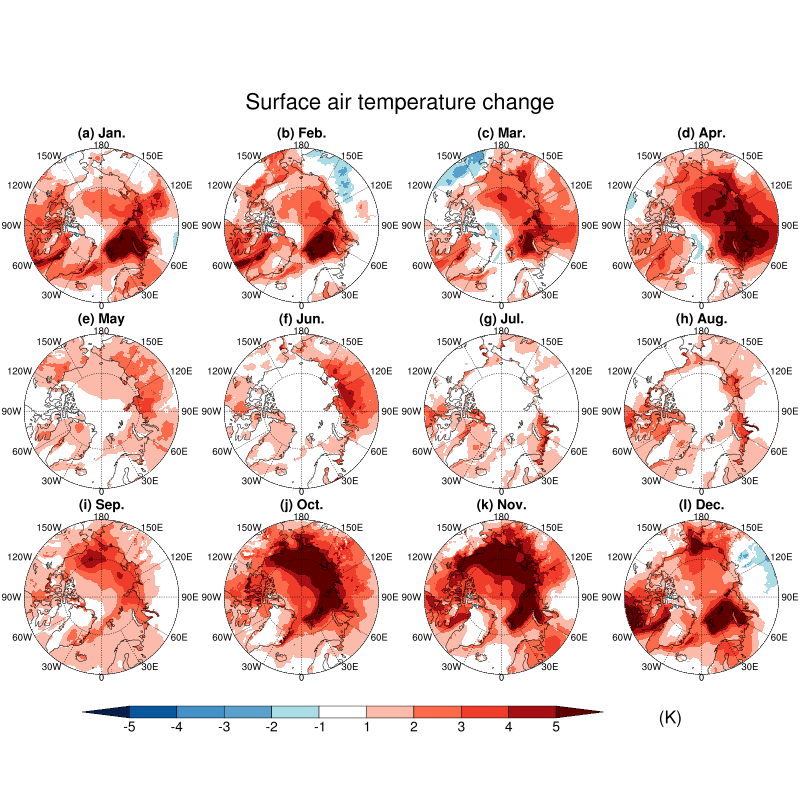
Longitude-Latitude plot/annimation
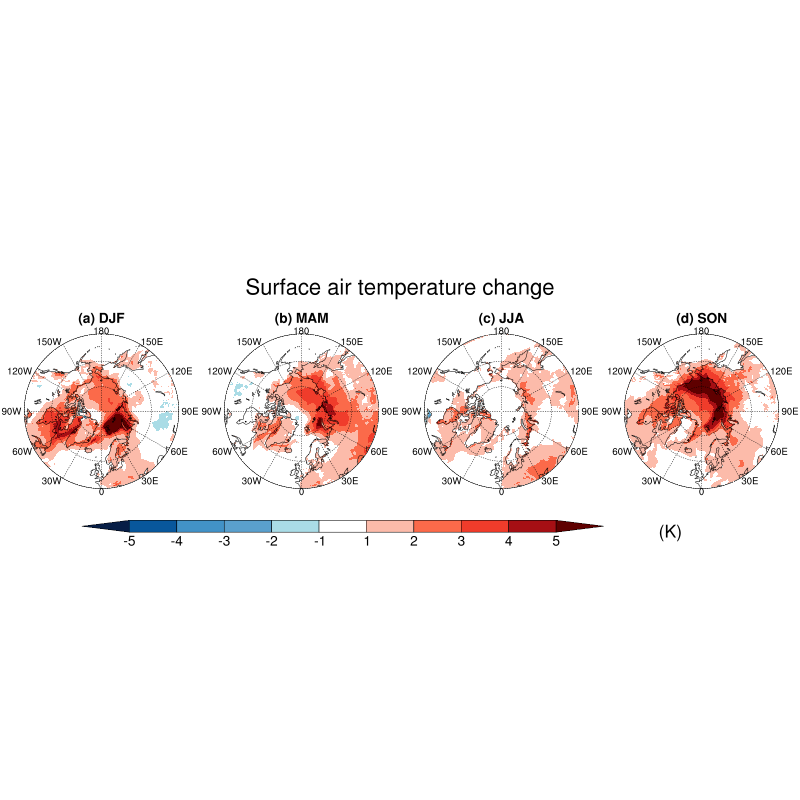
Polar stereographic plot
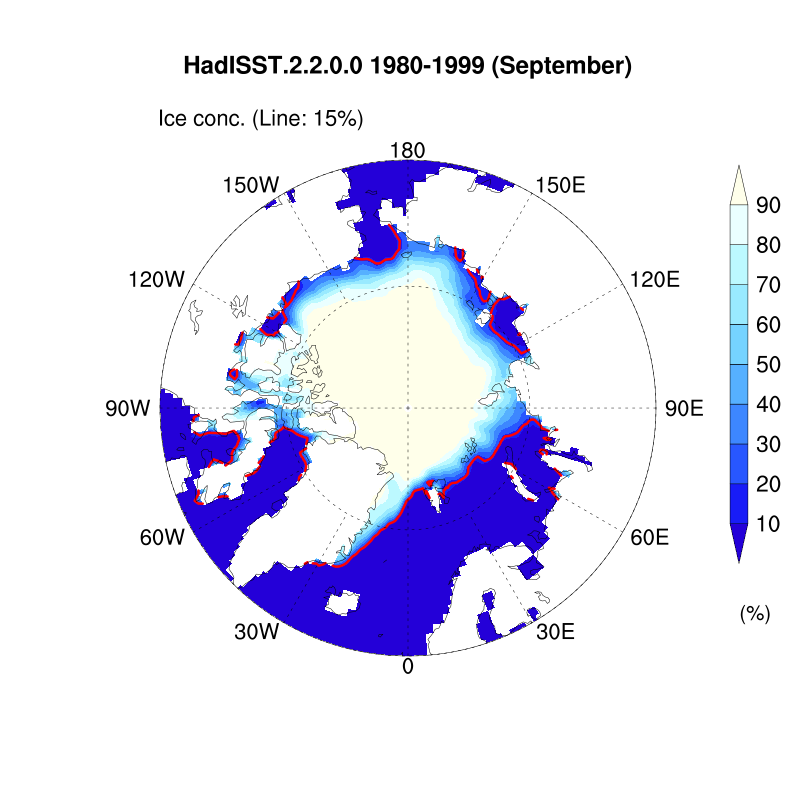
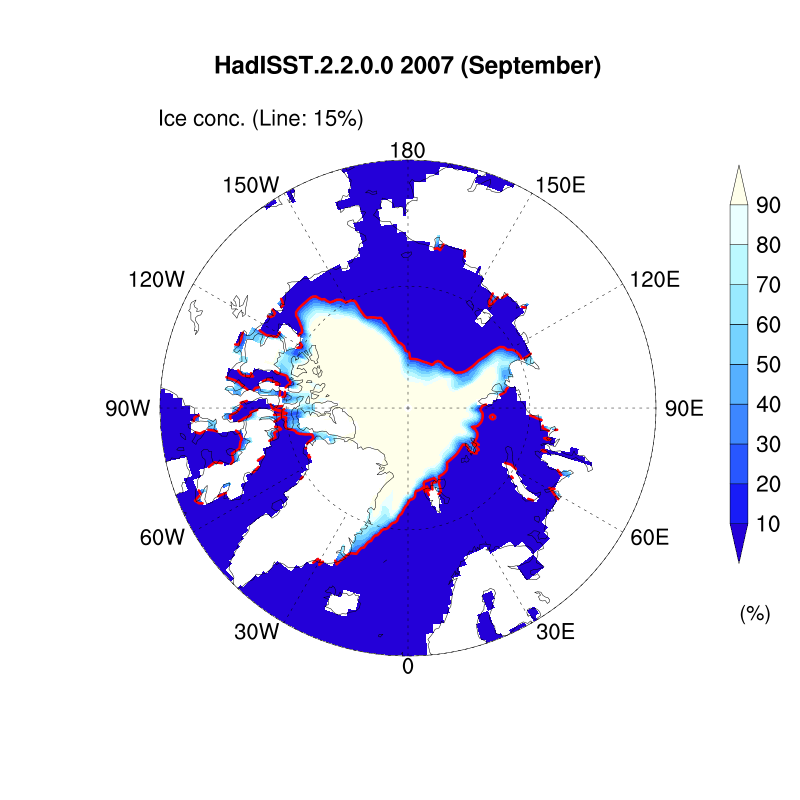
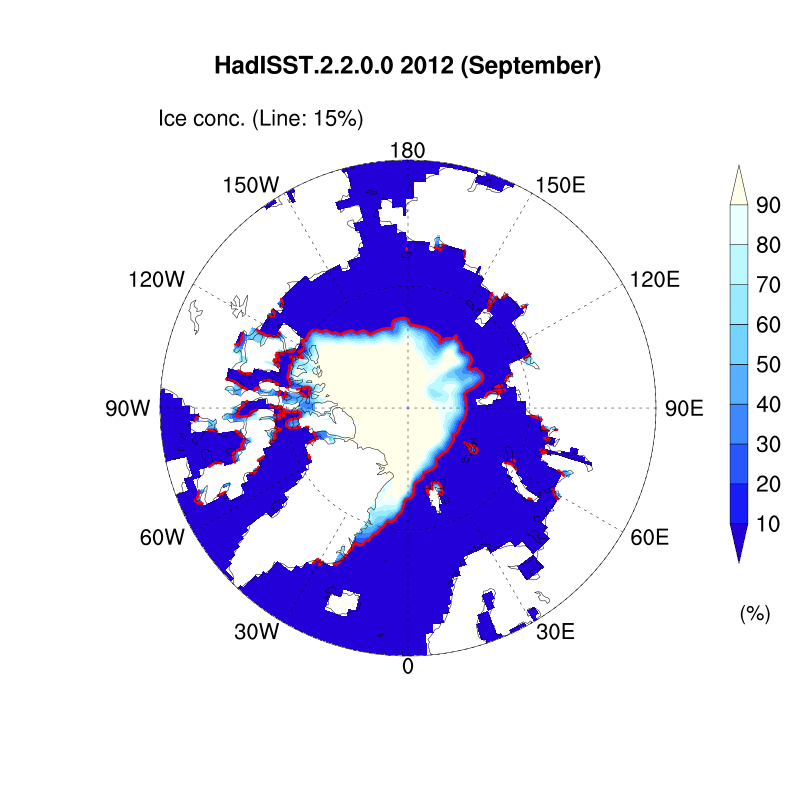
* Sea ice concentration data (HadISST.2.2.0.0) were downloaded from here in June 2018.
* Titchner, H. A., and N. A. Rayner (2014), The Met Office Hadley Centre sea ice and sea surface temperature data set, version 2: 1. Sea ice concentrations, J. Geophys. Res. Atmos., 119, 2864-2889, doi: 10.1002/2013JD020316.
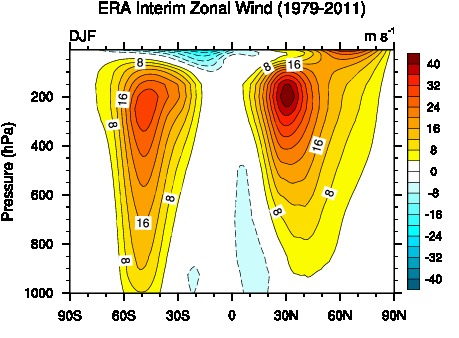
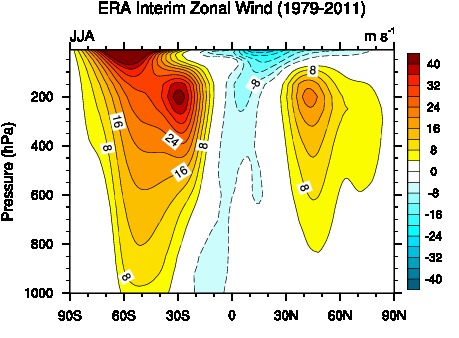
Latitude-Pressure plot
Panel plot
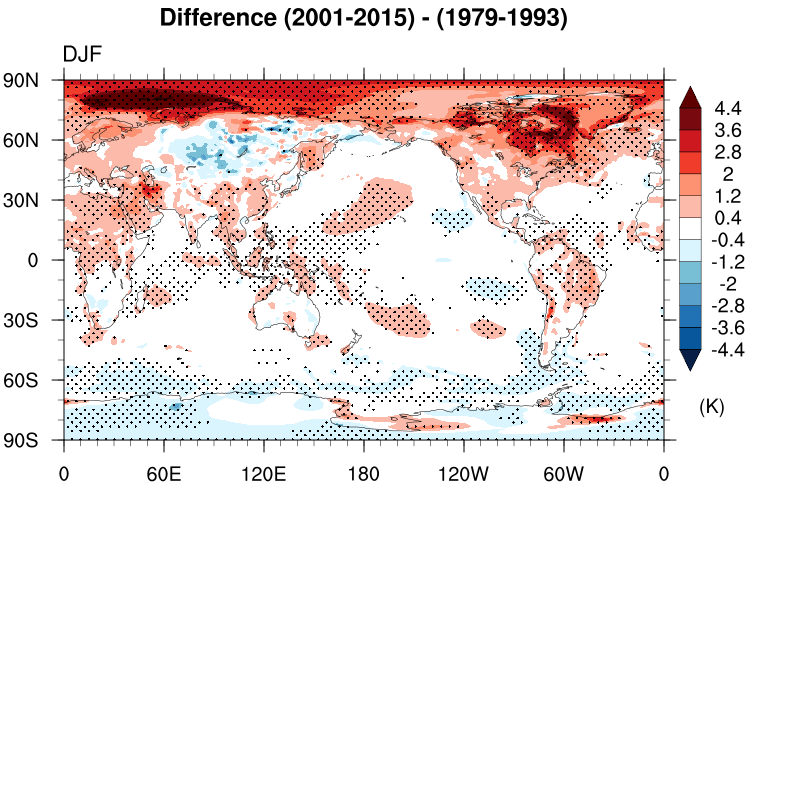
Statistical significance
Ice sheet drainage basin mask
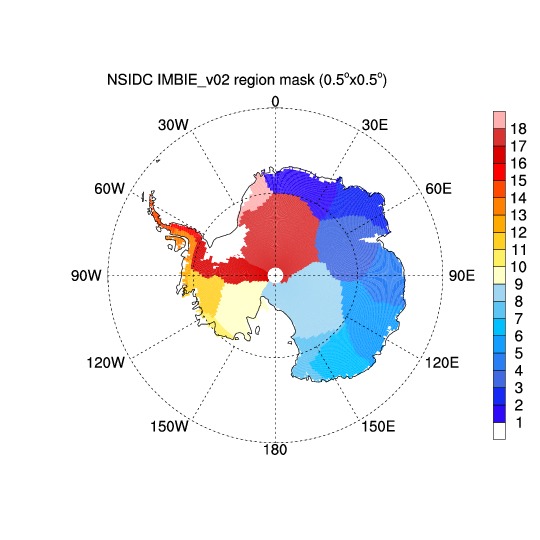
* Shapefiles were donwloaded from NSIDC and NASA/IMBIE in August 2018.
* A file, shapefile_utils.ncl, is required.
Interpolation
Colorbar preference
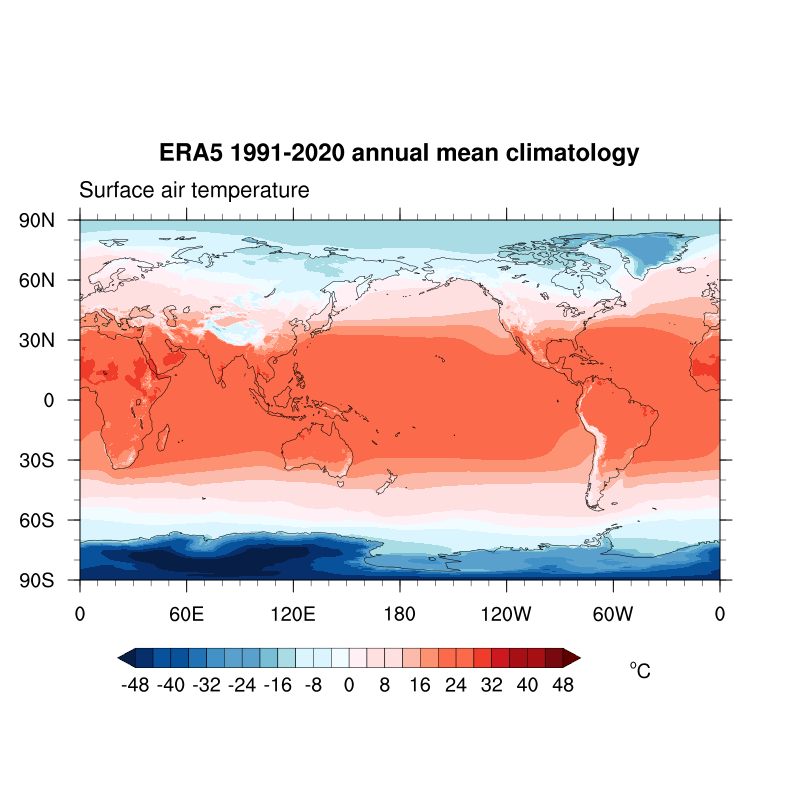
- temperature: "temp_19lev", "temp_diff_18lev", "nrl_sirkes", or "ViBlGrWhYeOrRe"
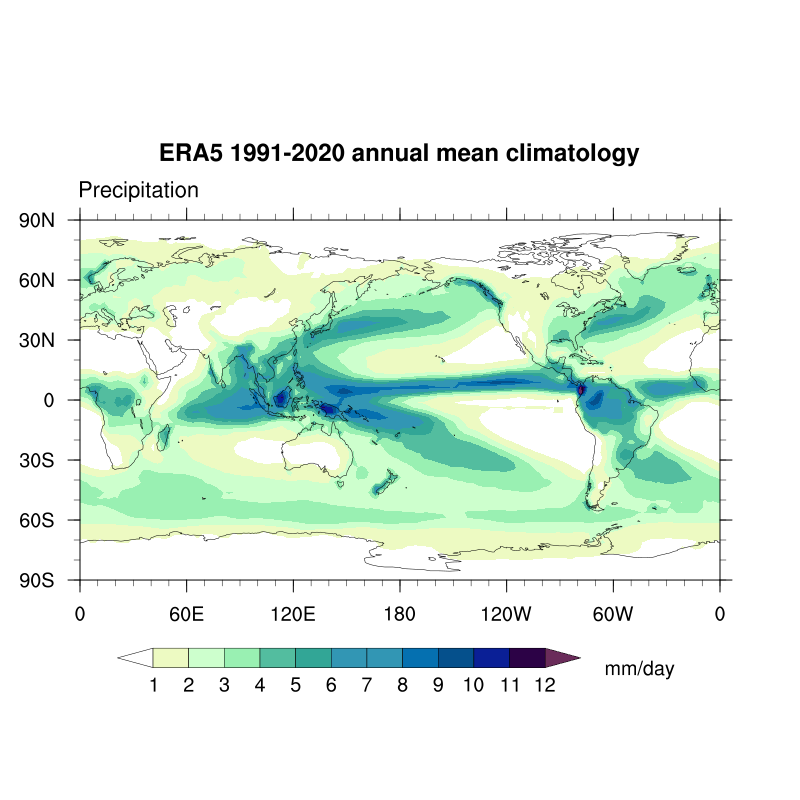
- precipitation: "precip_11lev", "precip_diff_12lev", or "CBR_drywet"
- Colar bars
Others
- Insolation (Figure)
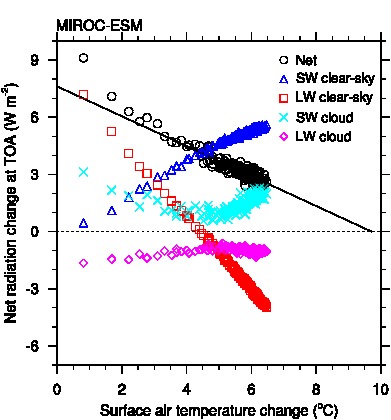
- Gregory plot (Figure)
- Ocean meridional overturning stream function
- Tips
- Write large file size in netCDF: setfileoption("nc","Format","LargeFile")
Links