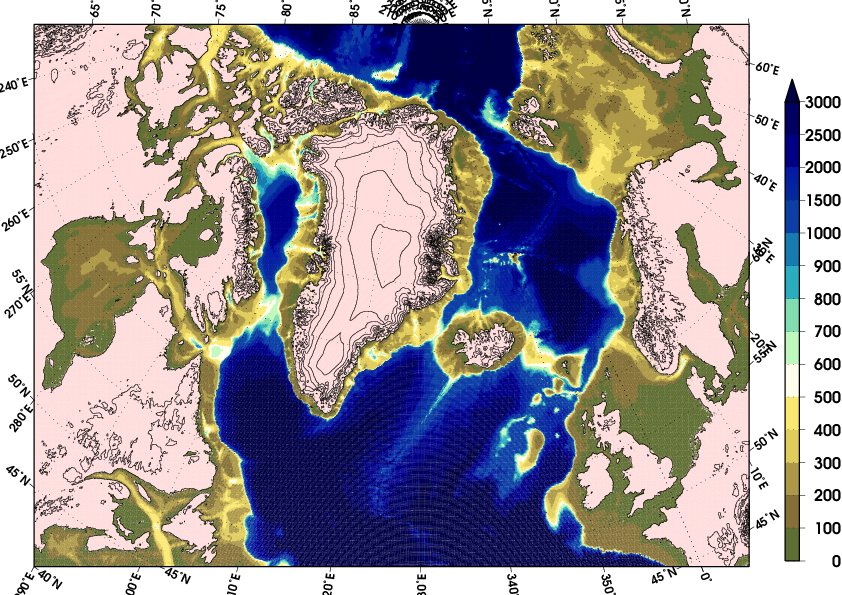


ここでは、無料で公開されているSmith and Sandwell's predicted bathymetryを使います。北極80.8度以上は欠損となっているので別データが必要です。
http://topex.ucsd.edu/marine_topo/mar_topo.html
から、Global topographyをえらび、
topo_(バージョン番号).imgをダウンロードします。このimgファイルはバイナリですが、xyz2grdなどと同じような感覚で、img2grdコマンドでGMTで読むことができるgrdファイルに変換できます。
img2grd topo_15.1.img -Gtopo.grd -R(緯度経度) -T1 -S1 -D -m1 -Vでgrdファイルに変換します。途中の-T,-D,-mは必要です(詳しくは、元データセットのreadmeを読んでください。)
描画のサンプルスクリプトは、
#!/bin/bash
grdfile=topo.grd
cont=500
contrange=-10000/0
cpt=topo4.cpt
proj=M10i
lat1=-70
lat2=70
lon1=30
lon2=390
region1=$lon1'/'$lon2'/'$lat1'/'$lat2
region2=$lon1'/'$lon2'/'$lat1'/'$lat2
echo $region
img2grd topo_15.1.img -G$grdfile -R$region1 -T1 -S1 -D -m1 -V
grdimage $grdfile -J$proj -R$region2 -C$cpt -K -Bg10a30/g10a20 > test.eps
grdcontour $grdfile -J$proj -R$region2 -C$cont -L$contrange -K -Bg10a30/g10a20 -O>> test.eps
で色分けできます。grdcontourを使って等水深線もかけます back