-
1.Minimum ice extent will be about 3.85 million square kilometers.
-
2.Sea routes of Russian side will open around July 31, and the Canadian side except for Canadian archipelago will open around July 10.
1.Minimum ice extent will be about 3.85 million square kilometers.
2.Sea routes of Russian side will open around July 31, and the Canadian side except for Canadian archipelago will open around July 10.
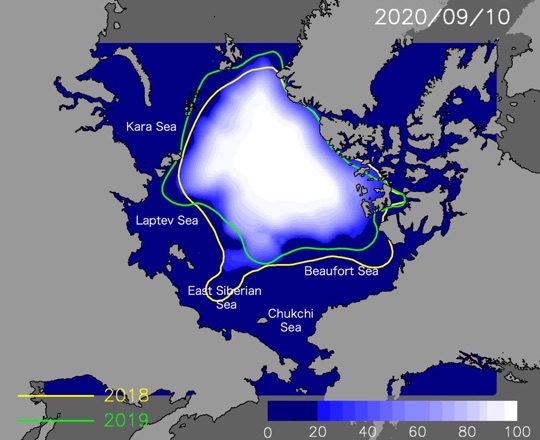
Figure1:Predicted sea ice cover on September 10, 2020.
Figure 3:Animation of predicted Arctic ice extent from the July 1 to the September 20. Yellow and green lines indicates the ice edge of the same day for 2018 and 2019.
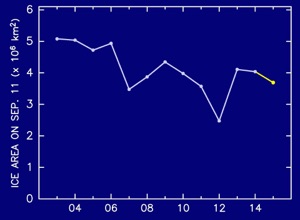
Sea ice extent on September 10 is expected to be 3.85 million square kilometers, which is 10% smaller than the last year’s minimum area and 13% larger than the record minimum in 2012.
Ice cover in the Russian coastal side will retreat with the nearly same speed as the last year. Sea routes of the Russian side will open around July 31.
Ice cover in the Beaufort Sea will retreat with the nearly same speed as the last year. Sea routes of the Canadian side except for Canadian archipelago will open around the July 10.
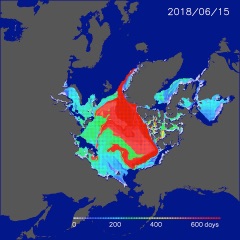
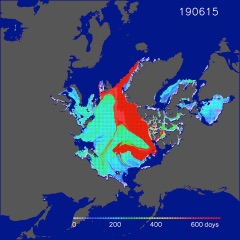
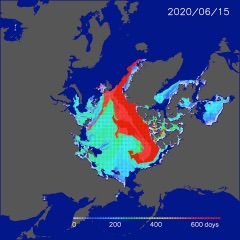
Additionally, Figure 5 presents the age of sea ice on June 15 of 2018, 2019 and 2020. Area of old multiyear ice was reduced in the last year and the area is still small in this year. There is a possibility that a large-scale ice retreat will occur in this summer because most of the Arctic Ocean is covered by thin first-year ice.
----
For this prediction, we used the sea ice data from satellite microwave sensors AMSR-E and AMSR2, and the relationship between the winter ice motion and summer ice concentration (Kimura et al., 2013). In this report, we use the data until April 30. This forecast also consider the long-term trend of sea ice concentration.
----
Ice prediction map is also available in Arctic Data Archive System of National Institute of Polar Research.
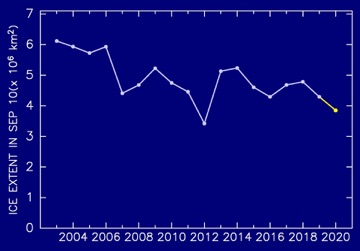
Figure 2:The interannual change of minimum extent since 2003. Value of 2020 is predicted one.
If you have any questions, please contact Kimura, Noriaki (kimura_n@aori.u-tokyo.ac.jp)
This work was supported by
Arctic Challenge for Sustainability Project.

Figure 4:Animation of the daily anomaly of the predicted ice concentration from 2003-2019 mean. Red color shows the area of faster ice retreat.
Figure 5:Map of ice age (in day) on June 15 of 2018, 2019 and 2020. Orange-red colored area shows multiyear ice area older than 400 days. Multiyear ice area is small in 2019 and 2020.
Arctic Sea Ice Forecast 2020
Second report:June 30, 2020
Atmosphere and Ocean Research Institute, The University of Tokyo